How do we know if someone is truly learning Refactoring and Test-Driven Development?
Before 2005, we determined proficiency by literally looking over people’s shoulders as they worked.
In 2005, we endeavored to automate the “looking-over-the-shoulder” part. We built code that used reflection to automatically check whether a student’s solution met certain design criteria.
Reflection was cool, yet by 2008, we wanted to know not only what a student programmed but how they programmed it!
Did they:
- Use automated refactorings?
- Run automated tests?
- Get “in the red” (i.e. have at least 1 failing test) and for how long?
- Stay or return to the green (when all tests are passing)?
By late 2008, we’d done it! Our new, automated analysis looks at both how a student does their work and what their final design looks like.
The images below were automatically produced by analyzing student lab work. The red and green background colors reflect how long the the unit tests were green or red, while the blue dots represent when the student used specific automated refactorings:
Student 1
This student is actually one of Industrial Logic’s Agile coaches. Since he recently came on board, he had not seen the lab before. He only got one red bar. He did take his time though!
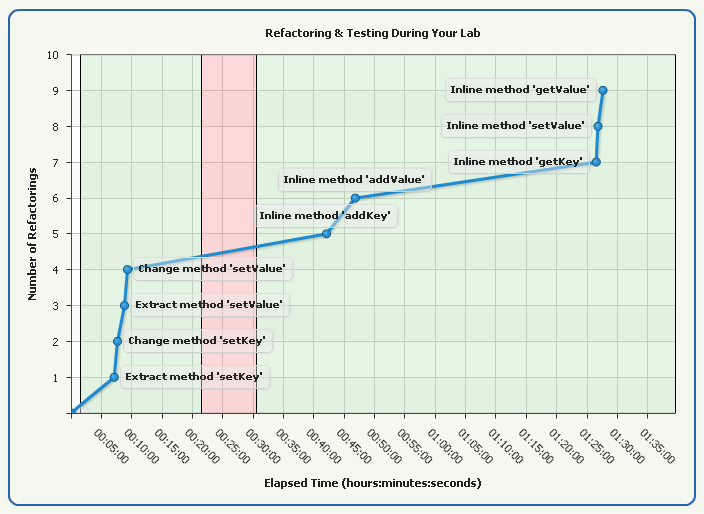
Student 2
This student had 4 points in time during which the bar went red. Numerous automated refactorings were recorded.
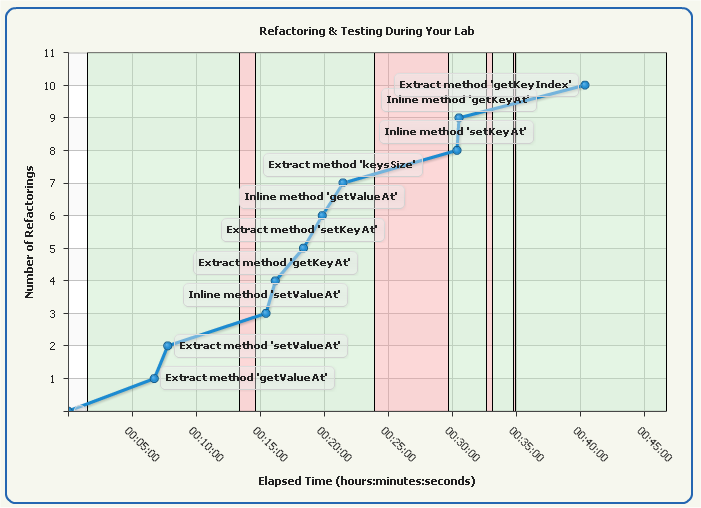
Student 3
The graph for this student indicates that work was done, since the bar goes from green to red to green. However, the student never once used a single automated refactoring. This may’ve been because they were using a tool that we don’t support.
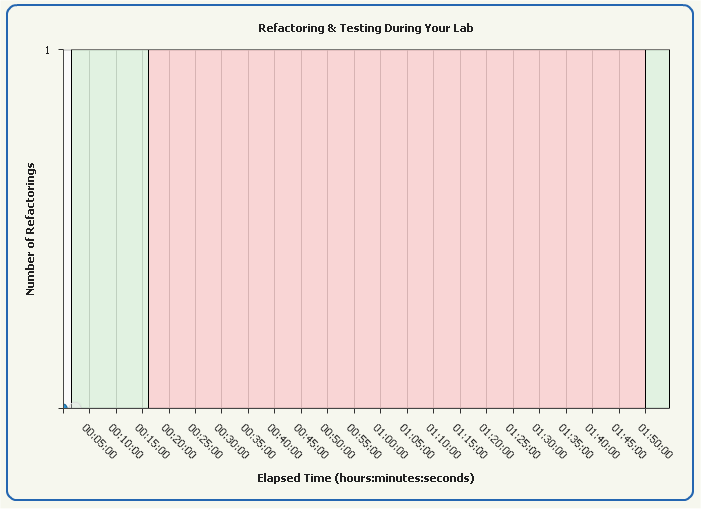
Student 4
This student took over 16 hours to do a lab and only ran the tests at the very tail end of the work.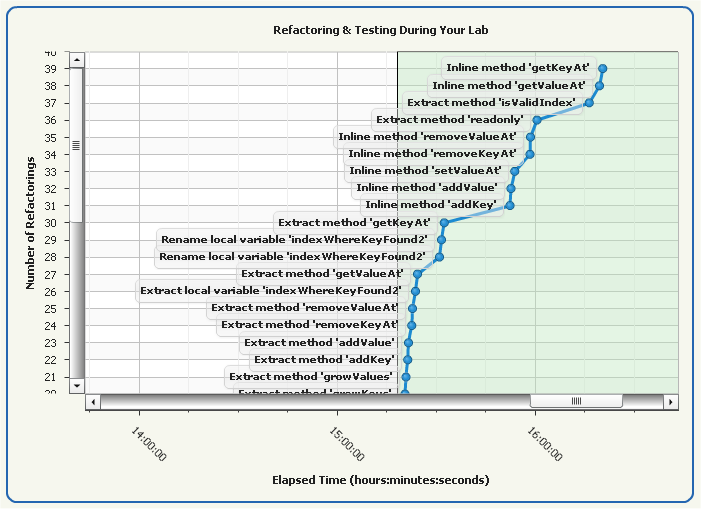
Students of our eLearning can now benefit from seeing their work graphed as shown in the above images.
In the near future, students will be able to compare their lab graphs to that of others, including experts. We hope that the new graphs will help students self-discover how to improve.