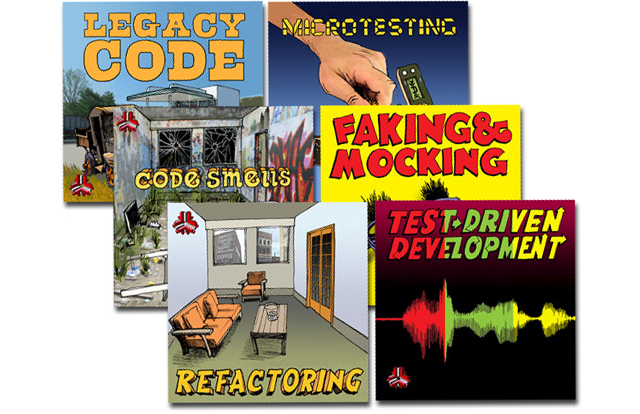
Over the last few months, we here at Industrial Logic have been working hard on a new album called Sessions.
This new album allows you to visualize, quantify & critique your programming sessions.
We are right now in the FREE Early Access Program for Java/Eclipse.
If you are interested in participating in this program, please email sales and mention "Sessions EAP."
The album comes with a client-side Recorder and a hosted, server-side, web-based piece that critiques your performance and presents easy-to-consume graphs and statistics.
We are currently supporting Java Sessions in Eclipse.
We will have a Visual Studio .Net Version, for use with ReSharper, within a few weeks.
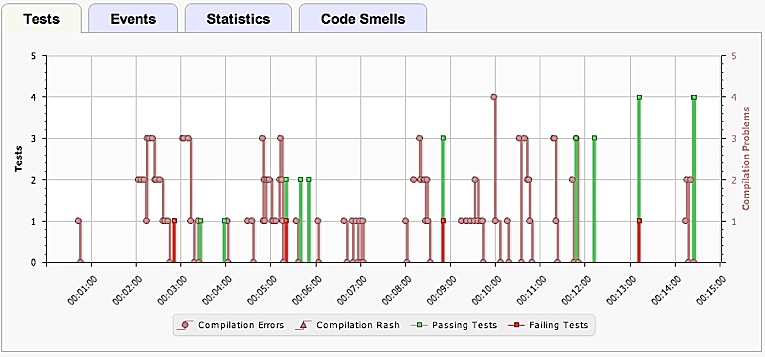
Here are some sample graphs from a 15-minute TDD session:
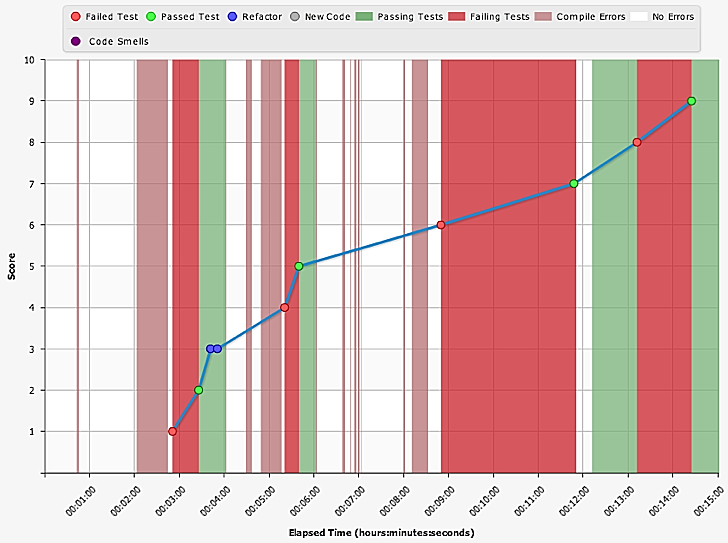
The top graph plots your score, as and when you perform various activities:
- start with a failing test,
- make a failing test green,
- perform a refactoring while in Green,
- perform refactoring while in red,
- add or remove code smells and
- many more.
The background colors of the graph represent the session state at a given point in time. It can be in:
- Red (failing test),
- Green (all tests passing),
- Pink (compile time error) or
- White (no error/none of the above) state.
On the live graph, if you hover over the dots, it shows details of the activity performed.
The bottom graph (in the Test tab) helps you understand the background colors of the top graph. The bottom graph shows:
- when and how many tests were run (highlights passing and failing test with respective colors)
- any compilation failures
- any compilation rashes (if you have a long compilation failure in many classes)
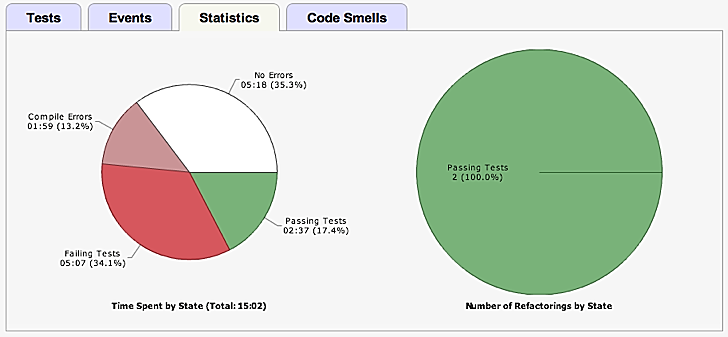
The above pie chart shows the time distribution in various states:
- Green,
- White,
- Compile Time Error and
- Failing Test
During a TDD session one would expect to see an equal distribution of states.
The other pie chart shows how many refactoring were performed in which state (Red, Green or White).
We consider it to be a good practice to perform refactoring while in Green state. However there are some safe refactorings that is OK to do while in red.
What would the graphs look like if you were focusing on just refactoring? The following graph shows a good refactoring session:
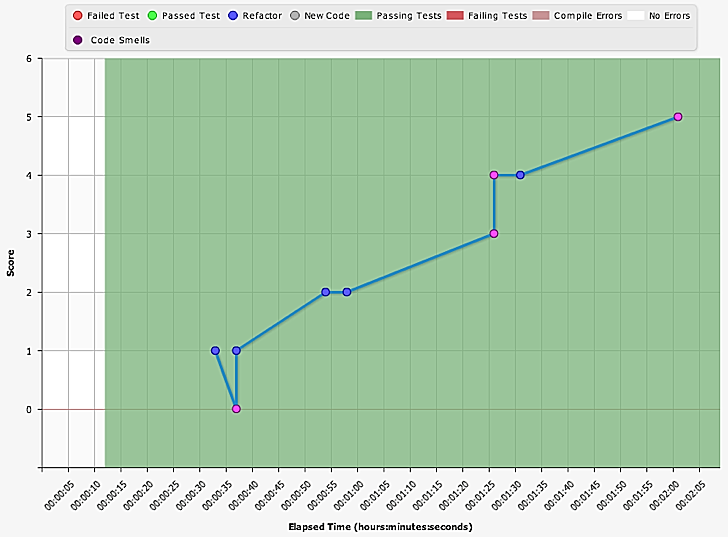
This graph shows that all the refactorings were done in the Green state, which is good.
Also some code smells were introduced and removed in the process.
Now let’s see what a poor refactoring session looks like:
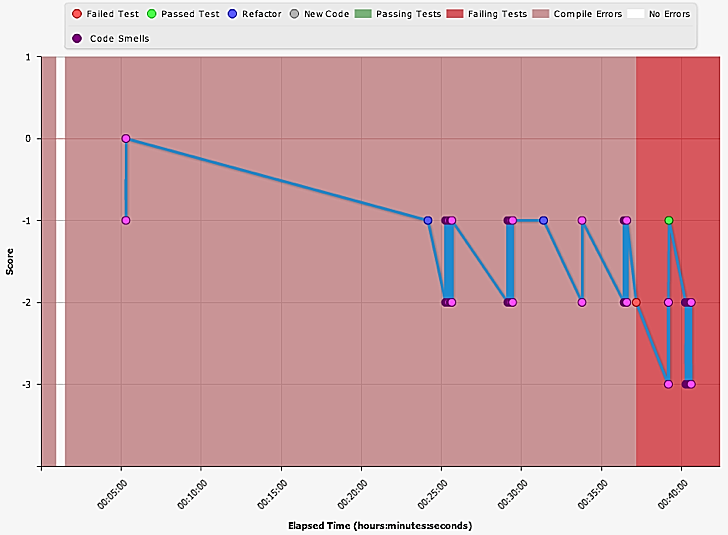
As you can see, the score is negative. All of the refactorings were performed in the red state and more code smells were added than removed.
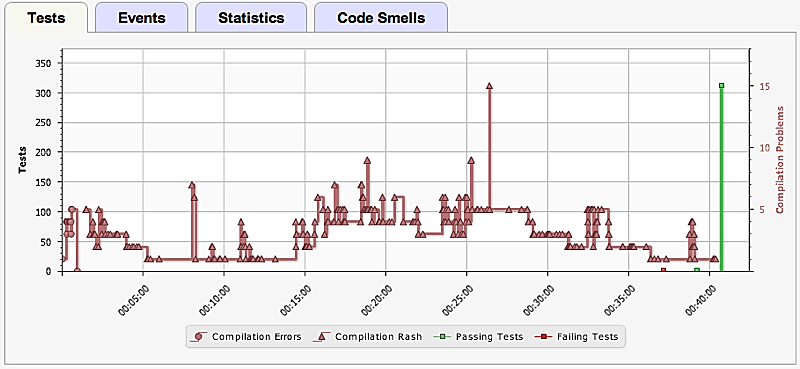
It’s very easy to notice that there is one compilation rash that lasted for almost 40 minutes.
While you are in Pink (compilation failure state), you can’t really run tests or ship your code. Hence for 40 minutes no tests were run. It looks so scary, not sure how someone survived through this.
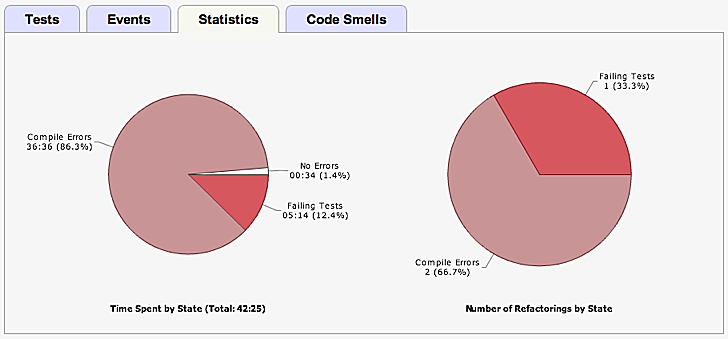
In the above chart we see that three refactorings were performed in the red/pink state and 86.3% of time was spent in the pink state.
This is only the beginning for Sessions.
We are striving hard to build Sessions into a tool that helps passionate developer become expert TDD practitioners.
BTW, we eat our own dog food. All programming sessions at Industrial Logic are recorded using Sessions.